Image Quality
This page is meant to collect some of the information about measuring HET's Image Quality (IQ) and using various tools in our operations.
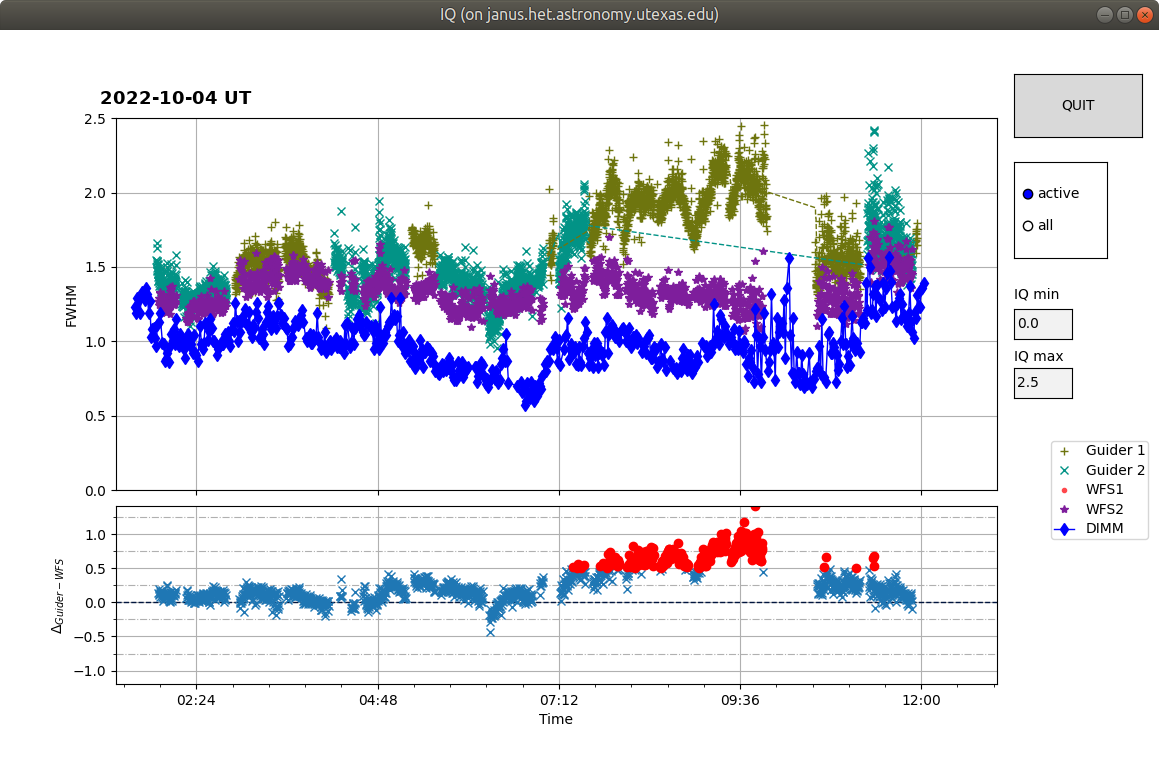
giq
This is a graphing tool created by Sergey (see also gtrans and gskyb) to plot real-time data during science operations. Here is an example of a screenshot where giq shows the image quality measurements across an entire night:

Run with giq at the command line. See giq -h for more help and options.
It shows various Image Quality measurements:
- blue circles: DIMM measurements, converted to ZD=35deg, 1-minute sampling
- red/purple symbols: WFS IQ (wfs.seeing_mean), is the "bottom-line" IQ, calculated from all spatial components in the WFS PAS pipeline
- gold/aqua symbols: Guider IQ, is the FWHM of the Moffat (?) profile fit to the star in each GC
It also show a difference graph of the difference between IQ(Guider) - IQ(WFS). This essentially represents the contribution of the M1 segment alignment ("stack") to the delivered Image Quality. Whenever this difference stays above 0.5" we should strongly consider re-stacking, as we are likely to gain that improvement in IQ with a re-stack.
There are more IQ-related quantities produced by the wavefront sensor pipeline, starting in October 2022. These are:
- lohobliq: This includes contributions from all spatial components of image quality.
- hobliq: This includes only the mid spatial frequency components plus the bottom-line image quality given by wfs.seeing_mean
These quantities will eventually be graphed and differenced, but are currently in development.
For further information, see this email from Hanshin from 7-Oct 2022:
lohobliq, in a perfect world, would be identical to the guider output, but it rarely does for many reasons. That is, however, not the main purpose.

This quantity, in conjunction with hobliq, will tell you how much low order component contributes to the image quality, which comes from mirror array global shape variation (not necessarily segment-to-segment variation).

In a way, this is similar to using guider output against seeing_mean, but it specifically calls out this smooth variation and I would include and use this differential as a secondary guide.
hobliq, in conjuction with seeing_mean, can tell you how much inter-segment contribution to the image quality there is, e.g. stack/piston.

Typically, when image quality blows up, the differential between these terms starts to grow.
Often time, the difference between lohobliq and hobliq grows much faster, which I interpret as a sign of the mirror structure deforming.

As such, it may give you an early warning to be prepared for a restack within the next 10~15 min. Usually, the rate of change in difference between hobliq and seeing_mean is slower so this may not be the quantity you need to follow closely.

I am hoping that incorporating the rate of change in those differentials might help you to better prepare for a restack a bit ahead of time.

Also, I would recommend you consider the expected improvement after a restack as part of restack preparation.

Often times, a re-stack occurred, but it did not improve the situation. This usually happens when the bottom-line image quality is already high.

Sometimes, the overall image quality is so bad compared to a (also bad) bottom-line, a re-stack improvement is noticeable, but other times, it isn't.

This, of course, needs to be guided by the information about the constraints in a particular observing program.

But considering what you expect to get after a restack will be useful in deciding whether to restack.
Attachments (1)
- giq_20221004.png (163.7 KB) - added by stevenj 19 months ago.
Download all attachments as: .zip